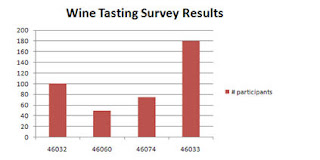
If your first column contains numbers, such as years, Excel will not recognize that you want this series to be on the X axis. Excel will just treat it as another series. In the example below, zip code has been treated as a series rather than displaying on the x axis as the user wanted.

- On the Design tab, click on Select Data
- Select Zipcode in the dialog box
- Click Remove
- Click on the Edit button in the Horizontal (Category) Axis labels dialog box
and select the zipcode data (A8:A11) as the Axis label range - Make sure not to include the heading zipcode
- Click OK
- Click OK
Now, you have a nice chart with Zipcode labels on the X axis!


No comments:
Post a Comment