

Quick Analysis Menu
If you select a contiguous set of data you will see a small icon display
in the bottom right hand corner. If you click the icon, the Quick Analysis menu
will display.
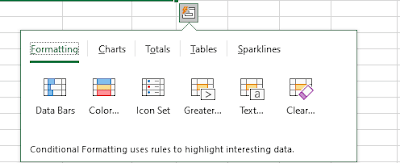
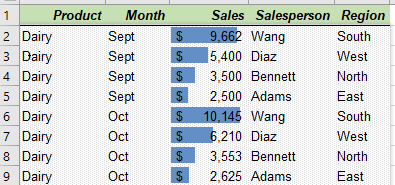
For example, if you have your data selected and then have your mouse hover over Data Bars in the Formatting option, you will see Data bars display in your worksheet if it finds numbers.
Move the mouse over to icon sets and icons will display.
Select Charts, from the top of the Quick Analysis menu, and you can select a chart type and have a chart instantly previewed for you.
Totals allow you to see different
summarization methods of your data – Total, Average, Running Total and More.
If you select Tables, you can quickly view a pivot table.
This menu is available in Excel 2013 and higher.
If for some reason, you do not have this menu and you have the Excel 2013 or higher, go to File>Options and look in the General Tab to make sure it is checked.
Alternatively, you can try CTRL+Q to turn it on or off.
