Best Microsoft Excel Bloggers

Monday, August 31, 2009

2 Input Data Table

Two Input Data Tables


It's Monday already and what a gorgeous fall day it is too - only problem is that it is still August! Autumn is my favorite season but I think it is a bit too early this year. I had a great weekend - spent quite a bit of it shopping which is always fun although I got to spend a fair amount of time outdoors. I even made it to the movies with my daughter to see Bandslam.
Anyway, last week I talked about 1 input data tables and told you that I would talk about 2 input data tables this week. The example I am using is a loan example since this is the most common use but tomorrow I'll give you some ideas of what else you can do with this.
Data Table- Two Inputs
In the example below, we are testing the effects of different interest rates and the investment amount so we are using both a row and a column input.


The row input is years and the column input is the interest rate. An input cell is one in which each input value from a data table is substituted.


Click in cell D6 and type: =B14.
Select the cell range D6:H12
Click the Data tab on the Ribbon.
Click the What-if Analysis button on the Data Ribbon and click Data Table from the menu.
Click in the Row Input Box and type: B10
Click in the Column Input Box and type: B8 as shown
Click OK

and Voila- you get the following:


Give it a shot and see what you think.

Wednesday, August 26, 2009

Data Tables - What-If Analysis

Okay- I couldn't sleep so I figured I would get a jump on the day's work and get my blog finished up early. As I mentioned before I am working on an Advanced Excel Analysis Tools Ebook for a course I am teaching at the Indiana CPA Society in September. One of my associates was fascinated with some of the Excel What-IF features I am covering so I thought I would share part of that with you. Today or tonight I guess- I am going to talk about one variable data tables.

DATA TABLES
A data table allows you to study the effects a range of values has on a formula. This is a timesaver as you only need to set the formula up once. A one-variable data table is a range of cells that shows the results of substituting different values in one or more formulas. Data tables are actually array formulas which allows them to perform multiple calculations at once. In other words, you can see a number of different scenarios at a single glance.
There are one-input and two-input tables. We are just going to cover one-input tables today.

ONE INPUT DATA TABLES
Input values can be either listed down a column or across a row. Formulas used in the data table must refer to the input cell which is the cell in which each input value in the data table will be substituted. Any cell can be the input cell.
Type the list of values you want to substitute in the input cell either down one column or across one row.


To Create A One-Input Data Tables (General Steps for Excel 2007)
1. Type the list of values you want to substitute in the input cell either down one column or across one row.
2. Enter the formula you want to use. If the data table is in column format, enter the formula in the first blank cell above and to the right of the top of the table. If the data table is in row format, type the formula in a blank cell to the left of the first value and one cell below the row that contains the values.
3. Select the data table, including the formula.
4. Click the Data Ribbon.
5. Click the What-if Analysis button on the Data Tools group and select Data Table from the menu.
6. Enter the input cell (the value that you want to substitute with the values from your data table). If the data table is in a column, enter the cell reference in the Column Input text box. If the data table is in a row, enter the cell reference in the Row Input text box.
7. Click OK.

Clear as mud? Okay - let's go through a specific example.

We are going to create a one variable data table. The variable that is going to change is the interest rate. This is also considered the input cell. The Data Table Calculation will look at the PMT formulas, the input cell (interest rate) and the cell we want to change (payment amount).

Basically, we have a column of interest rates and we want to determine what the monthly payment will be at each different rate.


(Click on the picture for a larger view. Sorry, I need to figure out how to add files out here). Email me if you want the file.

  • Observe the cell range D6.D12 which contains the interst rates. (highlighted in green).We have created a data table that we are going to use for substitute down payment values. We want to see how different rates will affect the monthly payment value.
  • In cell E6 type: =B14 and press Enter. [B14 is the PMT calculation]
  • The formula in cell E6 is the one whose values we want to display which in this case is the Payment Amt.
  • Select the cell range D6:E12 and click the Data Ribbon.
  • Click the What-if Analysis button and select Data Table.
  • Click in the Column Input Box and type: B8
  • Click OK
    Below is data table showing our results based upon the down payment values in our data table and our interest rates.


Look at all the different payments or scenarios if you will that you can see at once. Tomorrow or is it Thursday, I will show you an example of a 2 input variable. In that example, we will have interest rates and years as the 2 variables that change. Hey- this should be very handy if you are thinking of buying a new car or a new house however if you think about it, you can apply this to a lot of business situations. I'll give you an example tomorrow but see what you can come up with on your own.

Patricia

Keyboard Shortcuts

Sorry- I skipped yesterday - not on purpose... just lost track of time. And guess what? - I don't have a lot of time today either. Unfortunately, nothing exciting - just trying to complete the training manuals I am using at the the Indiana CPA Society next month. One course is on Advanced Tools for Analysis and the other is Timesavers for Experienced Users.

Anyway, I wanted to talk about the basics - keyboard shortcuts. If you are like me, you learned some of them in an intro Excel course ..oh so long ago and then promptly forgot them. Well, let me tell you the control key and the shift key are two that you don't want to forget.

CONTROL KEY
Selecting non-contiguous rows can be useful for formatting. For instance, if you find yourself formatting the top row and then the bottom row of your income statement as currency then this technique will be useful for you.

Selecting non-contiguous rows of data is easy. Simply select the first row of data as you normally would and then hold down the CTRL key on the keyboard and then select the next row of data. You can repeat this multiple times.

SHIFT KEY
If you’ve selected too much or too little, simply hold down the Shift Key and then use the arrows on the keyboard to add or reduce cells. The Shift Key locks you into place. This also works in Microsoft Word.

If you know the size of the data you want to select , you can click on the 1st cell that you want to select, hold down the Shift Key, and then click the last cell in the range and Excel will select everything in between automatically. In this example, if I click on Cell A1, hold down the Shift key and select C3, all the cells in between are selected.

By the way, these shortcuts also work in Microsoft Word.
Talk to you tomorrow.

Monday, August 24, 2009

Alternate Shading with Conditional Formatting

Hey- I hope everyone enjoyed the weekend.

I sure did - started the weekend out at the Naked Chopstix which has the best sushi ever. If you ever make it there, make sure to try the Maui roll! Ended the weekend at the Indiana State Fair eating kettlecorn and walking and walking. Along with the typical fair stuff, we saw a dog agility show, a car show and finished up with a demolition derby that my daughter loved. My favorite part was the car show where I saw my dream car - a 1958 Corvette - a beauty.

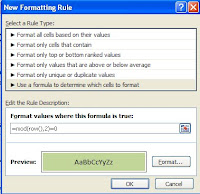
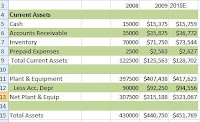
Anyway, let's talk about conditional formatting and applying rules. As I mentioned in my last post there is a lot you can do with conditional formatting and a lot of it is pretty easy to figure out but I thought it would be worthwhile to chat about using formulas and rules. Below are the steps you can use to apply a rule to data. In my example here I am using the MOD function and telling Excel to shade every second row of my P&L so that it is easier to read. I am specifying 2 in the MOD function so that every second row is shaded and I am specifying green as that is the traditional accounting color but obviously you can select any color you want - just make sure that it is light enough that that the data can be seen through it.


1. Select your data


2. Click Conditional Formatting on the Home Ribbon.
3. Select New Rule.
4. Click on Use a Formula to determine which cells to format.
5. In the rule description, type =MOD(row(),2)=0.
6. Click Format
7. Select a light green fill.
8. Click OK.
9. Click OK.


And voila.. it should look something like my example below:


Friday, August 21, 2009

Conditional Formatting - Overview

Oh my goodness.. Friday hurray!
I need to buy a birthday card for my Dad plus it is Friday and a very nice day so I need to get out and enjoy it however I have promised myself that I would try to write something every day. Let me make this short but sweet and talk about Conditional Formatting.

Excel 2007 has done a lot with conditional formatting. The feature was really beefed up in this newest version and with more people putting information online and having color printers, color formatting is taking off. It is a great way to visualize your data and can often help you pinpoint items of interest.

The great thing about the conditional formatting is that you can apply it to a cell or range of cells and nothing happens until the value or values specified change and meet the applied criteria.

For example, you can select a budget variance column and tell Excel to change any budget value to red if the variance is less than zero. The formatting only changes to red if a number in that column becomes zero or less. If later the variance returns to a positive, the red formatting disappears.

  • Here are just some of the things you can do with it.
  • You can format only cells that contain text, numbers or date values.
  • You can format only top or bottom ranked values.
  • You can format duplicate values.
  • You can use formulas to determine which cells to format!
Take a look at it at conditional formatting. Go to the Home Ribbon, go to the Styles tab and click on Conditional Formatting and see all the choices.

Next week when I have more time, I will overview a couple of things that you can do with Conditional formatting. The coolest thing I use it for is to have Excel shade alternate rows. I'll show you how to do that next week so check back. If you use conditional formatting for something interesting please let me know - I would love to hear about it.
Have a great weekend.

Ms. Excel- Resident Excel Geek