Best Microsoft Excel Bloggers

Monday, April 18, 2011

More on Slicers- Formatting & Connecting

More on Slicers - Formatting and Connections..

You can also do a bit of formatting with your slicers.
Click on a slicer that you have created and you will see a new contextual ribbon called Slicer Tools.

From here, you can change the size of a slicer as well as apply a formatting style.
If you look at the far left of the ribbon, you can see Slicer Caption which allows you to change the display name of the slicer.
If you select Slicer Settings you get the following dialog box.

The Slicer Settings dialog box also allows you to change the name of the field or the caption but it also allows you to determine different sorting and filtering parameters.


The other very interesting item on this ribbon is the Pivot Table Connections icon (2nd button on the ribbon). I have not played around a lot with this feature yet but what it allows you to do is share a slicer among different pivot tables. In other words, if you have 3 different pivot tables using the same data, you only need to set the slicer once and connect it so that the one slicer controls all 3 of the pivot tables. 
 This looks to be a pretty cool feature and should be particularly useful when doing presentations. Have fun playing around with it. I know I plan to.

Thursday, April 14, 2011

Slicers! A better way to filter Pivot Tables (Excel 2010)

If you use pivot tables, then you already know they are one of the best features in Excel. The good news is that Excel 2010 actually makes using pivot tables even better with their creation of the slicer. Sounds like a Ron Popeil commericial doesn't it?  It slices, it dices.....................


Anyway, in earlier versions of Excel, you could filter pivot tables but the field you filtering had to be in the pivot table and the drop-down box would just display the text "multiple fields" so no one at a glance knew what the heck you were filtering and displaying in your pivot table.

The slicers are essentially dialog boxes containing all the field names that remain on the screen. You select the ones you want and the data in the pivot table adjusts to what is specified.

Here are the steps

  • Click in your pivot table


  • Click on the contextual Options tab
  • Select Insert>Slicer
  • Click Insert Slicer...


A dialog box of all the field names that comprise your data (not just the data in the current pivot table) displays

  • Select your field (s)
  • In this example, I selected multiple fields -Ship Via and Customer Name


  • Click OK

The selected slicers display on the spreadsheet

  • Click on the fields that you want to see.
 To select multiple fields in Ship Via for instance, select the first one and then hold down the control key to select the next.     
In my example, I selected Fed Ex, Parcel Post and UPS from the  Ship Via slicer and I selected the Backyard Cycle Shop as the customer I was interested in.

The pivot table now displays only data  for that one customer if one of those 3 specified carriers were used.

How cool is that.  The slicers stay there on the page and can be moved around so now you can clearly see that is being filtered and displayed in the pivot table. Think how useful this could be on a dashboard.                                                                 


Wednesday, April 6, 2011

Pivot Table - Rolling Up Dates

I am in the process of updating my Pivot Table course for Excel 2010 so I thought I would go through some of the fun things you can do with pivot tables here in my blog.  The new slicer function is extremely cool but let me start with a few basics before I get there. Today, I want to talk about rolling up dates in a pivot table.
You can do it in all the versions - it is just a little bit easier in Excel 2010.
  • First, you click in your data and select Insert>Pivot Table
  • Then drag the field from the Field List Dialog box to the specified area.
  • In my case I dragged Order Date to the ROW, Ship Via to the COLUMN and Order Amount to the VALUES section


to create the pivot table below.
 
 
There are a  lot of orders here so the pivot table is not that useful. It would be useful if I could see orders by month, quarter or by year. In other words, I want to "roll" up the dates and view it by month and by year.

  • You can either right-click on the dates

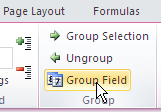
  • or in Excel 2010 you can also click on the Group Field icon on the contextual Pivot Table toolbar.


Either of these methods brings up a Grouping date dialog box.


At the top, it displays the newest and the oldest data.
  •  In this dialog box, I selected months and then held down the Control key to also select Years.
(It is recommended that you always select years - if you do not and there is more than one year of data, Excel will not differentiate and will instead treat it all as a single year).


Now, the orders in my pivot table display by Year and by month and is much more useful than the first pivot table.


You can hide the individual months by clicking on the button immediately to the left tof the year or by right-clicking and selecting Expand/Collapse.


Also, if you take a look at the pivot table field list, you will see that you have a new field called Years that did not exist before. You can move this field around in the pivot table and you can even use it in a new pivot table that is based upon this one.

Thursday, March 17, 2011

Unhiding Column A - Happy St. Patty's Day!

Happy St. Patrick's Day!!!!!!!!!!!!!


Hide and  Unhide


Unhiding a column is usually pretty easy. All you do is select the column header to the right and to the left of the hidden column and then right-click and select Unhide.


 In the example below, Column B is hidden so I selected across the Column A header and Column C header (which means that Column B was also included) and then selected Unhide from the shortcut menu.


Unhiding is a little more difficult when you have hidden Column A. To unhide Column A you need to go to the Name Box located above Column A and B and type A1.


 Then press Enter.


This forces Excel to put the cursor into cell A1. At that point, you can right-click and select Unhide. It may look like nothing happened but Excel did unhide it. Excel tends to keep the width so small that you may still not be able to actually see Column A even though it is unhidden. If that is the case, move your cursor carefully until you get the cursor to look like a 4 headed cross which will allow you to widen Column A.


Thursday, March 10, 2011

Variance in a Range

Someone asked me how to find the variance of  the highest number and the lowest number in the same range of data.  The simplest way to do it is =Max(range)-Min(range).
In the simple below, I applied this formula =MAX(A3:A11)-MIN(A3:A11) so that Excel found the highest number in the range which was 90 and then subtracted it from the lowest number it found which was 5. So, we end up with a variance of 85.


Ms. Excel- Resident Excel Geek