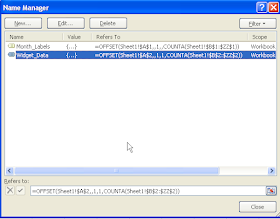
In most cases people tend to add data to a chart vertically however there are instances where you need to add columns of data to your chart. To have the chart automatically pick up additional columns as they are added you should use the OFFSET function.
In the example below I have widget sales for January through March.
I wanted to create a chart so that as I added April through December sales into the chart, the chart would automatically include the new data without me having to do anything to the chart.
Then I need to identify each of the 2 rows to Excel by creating defined names.
We are going to create a name and formula for the months and then for the widget sales.
Go to the Formula tab and select Define Name
- In the Name box type Month_Labels
- In the Refers To box: type =OFFSET(Sheet1!$A$1,,1,,COUNTA(Sheet1!$B$1:$ZZ$1))
- Click OK
Now we need to define the widget sales
- Go to the Formula tab and select Define Name
- In the Name box type Widget_Data
- In the Refers To box: type =OFFSET(Sheet1!$A$2,,1,1,COUNTA(Sheet1!$B$2:$ZZ$2))
- Click OK
 This is telling Excel to go to cell A2 and to move over 1 column and select data from B2 through Column ZZ.
Click in the chart and select the data series and replace the cell references to the formula names of Month_Labels and Widget_Data
Now as you add April and May's data, Excel will automatically include it in the chart.
Click here to download the Excel file.


great tip - saves updating all those chart data ranges. cheers
ReplyDelete