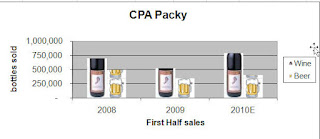
 Using Graphics as a Data Series
Adding a graphic can be a really nice effect particularly if you are doing a presentation. Of course it can also depend upon your product line. I've seen annual reports of some pharmaceutical companies using a pill/capsule in column charts so people really do use it.
Basically you right-click on the Series and select Format Data Series and then you can insert a graphic file. A quick alternative is to put a piece of clipart on your spreadsheet and then simply copy the graphic, select the data series and then paste it.
All the steps are below. Have some fun!
Right-click on the data series
Select Format Data Series…
Click on Fill
Click Picture or texture fill
Click Insert from:…..File
Browse and select the folder that contains the picture you want to use
Click Insert
Click Stack - there are other options here... depends on the size of the chart and the graphic what you want to use.
In the example, above, I inserted the wine bottle which was a .jpg file and pasted in the beer mug which is clipart that I already had on the spreadsheet.


No comments:
Post a Comment